Most dental dashboards are built to look good in a sales demo. Thirty-odd tiles, four colours, nothing that tells the office manager what to do at 7:45 on Tuesday. The ones that get opened every morning are smaller and duller, and they are wrong less often.
Quick answer. A useful dental practice dashboard shows at most eight numbers for one role, each against its own trailing average, each opening to the rows behind it. Owners need net production, collection rate, production per hour, over 90 receivables and unscheduled treatment. Managers need today. Hygiene needs recall and open hours. You can build the owner version free in a spreadsheet.
What does a useful dental dashboard show?
Every tile has to answer one of two questions: is this normal, and if not, who do I call. Three rules do most of the work.
- One role per dashboard. The owner, the office manager and the hygiene lead need different numbers.
- Every number against its own average. $734 an hour means nothing. $734 against a 12-month average of $760 means something.
- Every number opens to its rows. If a tool cannot show the 83 appointments behind a 9% no-show rate, the number cannot be checked.
The full design rules are on the dental KPI dashboard page. This page is about the build, the sources and the tools.
What should a dashboard hide?
Cut these before adding anything.
- Gross production. It is the fee schedule, not what the practice can collect. Show net.
- Total active patients. A status field that nobody updates. Show patients seen in the last 18 months instead.
- Anything that cannot be traced to a ledger row. If nobody can say which report it comes from, delete it.
- Tiles that are always red. A tile that is red every month teaches people to ignore red.
- Social media followers and website visits. Fine for marketing. Not a dental practice number.
Which numbers does each role need?
| Role | Number | Formula |
|---|---|---|
| Owner | Net production | Production plus adjustments minus write-offs |
| Owner | Collection rate | Collections divided by net production, trailing 90 days |
| Owner | Production per scheduled hour | Net production divided by scheduled hours |
| Owner | Over 90 receivables | Balance aged over 90 days divided by total receivables |
| Owner | Unscheduled treatment | Fee value of treatment planned with no appointment |
| Office manager | Open time, next 2 days | Unfilled scheduled hours by column |
| Office manager | Unconfirmed patients today | Count on today’s schedule |
| Office manager | Claims over 30 days | Count and dollars outstanding |
| Hygiene | Overdue recall, nothing booked | Patients past their recall date with no future appointment |
| Hygiene | Reappointment rate | Hygiene patients leaving with a next visit booked divided by hygiene visits |
| Hygiene | Open hygiene hours, next 2 weeks | Unfilled hygiene hours |
| Hygiene | Hygiene production per hour | Hygiene net production divided by hygiene scheduled hours |
More formulas and worked examples are on the dental practice KPIs page and the office manager weekly report.
What is a worked example?
A practice reads last week. Net production is $82,600. Collections are $78,470. Scheduled hours across all providers are 112.5.
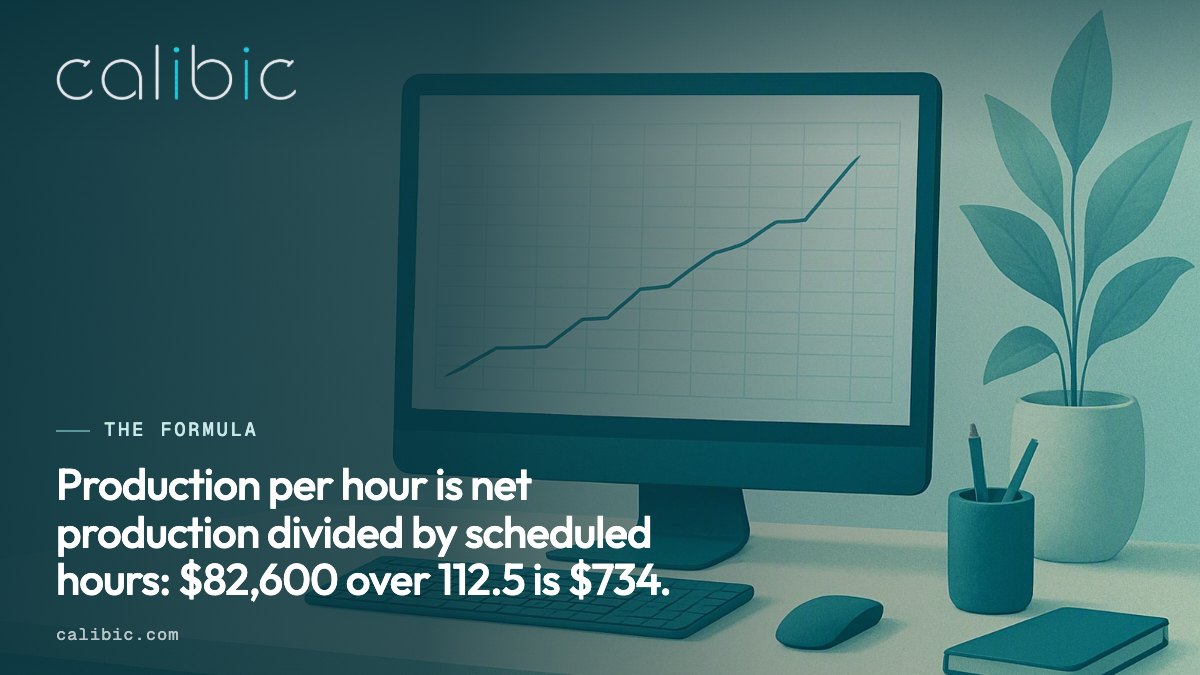
The 12-month average is $760 an hour. Last week is $26 below that. One week is not a trend. Three in a row is. That is why each number needs its own average beside it.
Where do the numbers come from in Open Dental, Dentrix and Eaglesoft?
| Number | Open Dental | Dentrix | Eaglesoft |
|---|---|---|---|
| Net production and collections | Reports, Standard, Production and Income | Office Manager, Analysis, Practice Advisor, Practice Advisor Report | All Reports, Daily Production/Collection Summary |
| Provider production | Production and Income, Provider option | Practice Advisor Report (dentist and hygienist totals) | Providers Reports, Provider Productivity |
| Aging | Aging of Accounts Receivable report | Aging Report | Aging report |
| Unscheduled treatment | Treatment Finder (Lists) | Unscheduled Treatment Plans | Unscheduled treatment report |
| Outstanding claims | Outstanding Insurance Claims report | Insurance Claims aging | Outstanding claims report |
| Morning snapshot | Not a single report | Daily Huddle report | Not a single report |
Dentrix describes the Practice Advisor report as covering production, collections and aged receivables, new patients, continuing care and schedule management, compared with benchmarks. Eaglesoft’s Provider Productivity and Daily Production/Collection Summary names come from Dental Intelligence’s own Eaglesoft reconciliation guide. See the system guides for Open Dental production, Dentrix reports and Eaglesoft reports.
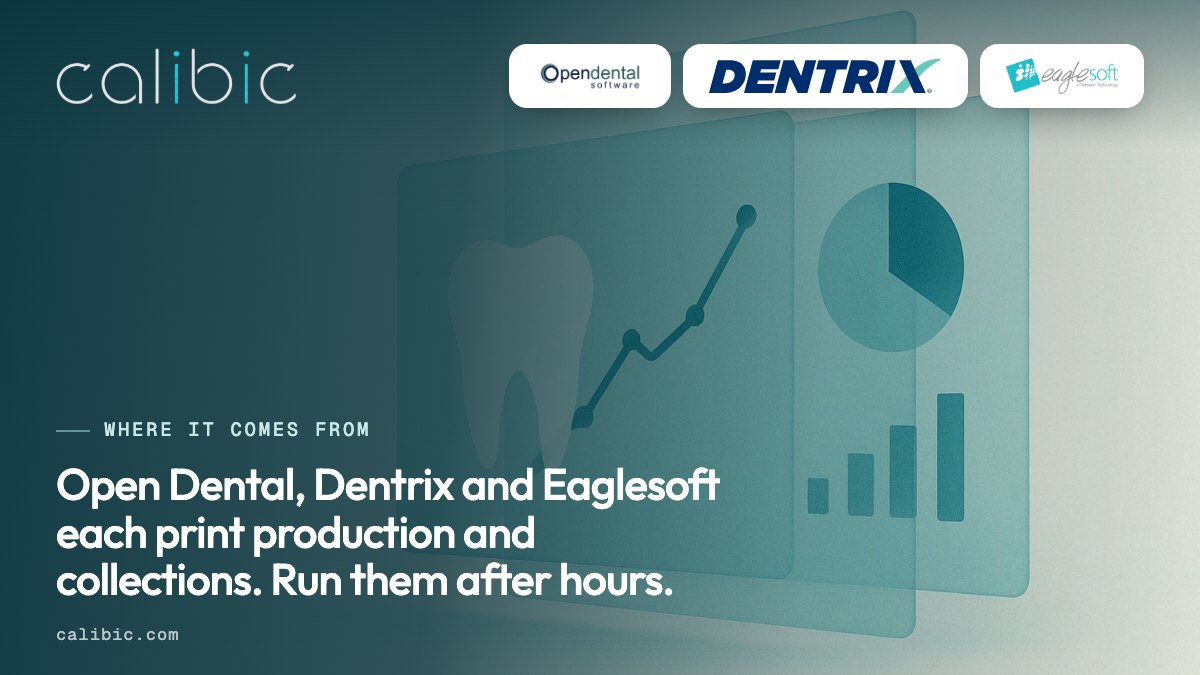
Run reports after hours, once everything is entered. The same-day numbers shift if someone posts an adjustment at 4:50 p.m.
How do I build a free dental dashboard in a spreadsheet?
- Make a weekly sheet. One row per week. Columns: week start, net production, collections, scheduled hours, over 90 receivables, unscheduled treatment.
- Type the five inputs from the reports above. Same report, same date range, same day each week.
- Add four formula columns. Collection rate is collections divided by net production. Production per hour is net production divided by scheduled hours. Over 90 share is over 90 receivables divided by total receivables. Four-week average of production per hour is the average of the last four rows.
- Chart two lines. Production per hour and its four-week average. A gap that stays open for three weeks is the signal.
- Add one conditional format. Colour a cell only when it is below its own average by an amount you set, for example 8 percent.
This takes an afternoon and costs nothing. Its limit is the weekly typing: when pulling the numbers becomes someone’s job, or when you want to click a number and see the patients behind it, software earns its fee. Keep the sheet’s inputs free of patient names so it stays out of PHI territory.
Which dental dashboard tools can I verify?
All facts checked 13 October 2026 from each vendor’s own public page unless noted. Prices are shown only where the vendor publishes them.
| Tool | What it is | Works with | Published price |
|---|---|---|---|
| Calibic | Read-only analytics layer: ranked daily list, Daily Huddle, dashboards, audit trail. Not a texting or phone product | Open Dental, Dentrix, Eaglesoft | $149 per location per month, or $119 billed annually |
| Dental Intelligence | “Practice performance platform”: analytics, scheduling, engagement, payments, insurance | Open Dental, Eaglesoft, Dentrix, Dentrix Ascend, Denticon | None shown on its page |
| Practice by Numbers | Analytics plus patient relationship management, voice, payments | 25 systems listed, including Curve Dental | “from just $249/month” |
| Jarvis Analytics | Henry Schein One cloud dashboard, 50+ KPIs, built first for DSOs | Dentrix, Eaglesoft, Open Dental, Denticon and others | None shown on its page |
| Dentrix Practice Advisor | Report inside Dentrix: production, collections, aging, benchmarks | Dentrix only | Not stated on the page we found |
| Videa | Dental AI platform with a Daily Dashboard and Insights module | Not stated on the page | None shown |
| Dentistry Dashboard | UK-focused AI notes and a team Practice Hub (rota, daily checks, lab tracking) | Not a PMS analytics tool | Practice Hub £99 per month per location |
Honest notes on each.
Calibic reads your practice database and never writes to it, so it cannot fix a record, only show you. It is not a patient messaging product: texting and campaigns are on the roadmap, not live. It does not support cloud-only systems such as Dentrix Ascend today, and Eaglesoft coverage is partial. Pick it if you keep your own phones and reminders and want a published price.
Dental Intelligence and Practice by Numbers are suites. If you want reminders, payments and analytics under one login, look there first. Dental Intelligence says it is trusted by more than 10,000 practices and PbN says 5,000+ (both self-reported). Neither shows per-plan prices on the pages we read; PbN shows a starting figure only.
Jarvis Analytics leans toward groups. It opened to private practices in 2022, per Dental Products Report.
Dentrix Practice Advisor is the report to try first if you already run Dentrix. Ask Henry Schein One whether your license includes it.
Dentistry Dashboard is the site that ranks first for “dental dashboard”, and it is not a production dashboard. Its products are AI dental notes and a team rota and checklist hub, priced in pounds. Useful for a UK practice, not for the numbers in this guide.
What about Open Dental’s dashboard?
Open Dental’s manual describes Patient Dashboards, set up under Tools, Patient Dashboards, and edited like Sheets. They show fields about one patient. They are not a view of practice performance. Practice numbers in Open Dental come from the Production and Income report and the lists above.
What should I do next?
Pick one role. Write down its five numbers and the report each comes from. Build the spreadsheet this week. In a month, you will know whether you want software.
If you want the same view live, with every number opening to its patients, see the Dashboards product page.
As of 13 October 2026. Calibic is not affiliated with any vendor named here.
Sources
- Open Dental manual, Standard Reports: https://www.opendental.com/manual/reportsstandard.html
- Open Dental manual, Dashboard Setup: https://www.opendental.com/manual/dashboardsetup.html
- Dentrix, Generating the Practice Advisor Report: https://www.dentrix.com/articles/show/438/
- Dental Intelligence, Eaglesoft: Reports (reconciliation guide): https://learn.dentalintel.com/en/articles/909502-eaglesoft-reports
- Dental Intelligence, checked 13 Oct 2026: https://www.dentalintel.com/
- Practice by Numbers, checked 13 Oct 2026: https://www.practicenumbers.com/
- Jarvis Analytics, checked 13 Oct 2026: https://www.jarvisanalytics.com/
- Jarvis opened to private practices, Dental Products Report (2022): https://www.dentalproductsreport.com/view/jarvis-analytics-now-available-for-private-dental-practices
- Videa, checked 13 Oct 2026: https://www.videa.ai/
- Dentistry Dashboard, checked 13 Oct 2026: https://dentistrydashboard.com/
- Dentrix, checked 13 Oct 2026: https://www.dentrix.com/